By Zach VanderLeest, Ryan Bergman, Matt Darr, and Chris Murphy, Agricultural and Biosystems Engineers
As spring plans are finalized, don’t forget to consider aerial imaging as part of a continuous improvement plan. Remote sensing and the use of aerial imagery has been used for decades in agriculture, but since 2010 we’ve seen the number of available imagery providers grow extensively.
The use of imagery can vary from farm to farm, but several common uses include variable-rate fertility recommendations, assessing water management performance, quantifying soil compaction and machinery-induced yield limiters, locating late-season weed outbreaks, and generally evaluating the consistency of crop vigor across a field.
Three primary factors impact the cost and typical uses of remote sensing imagery.
- Resolution of the imagery. This defines how much detail is visible and can range from being able to see an individual plant to a width similar to a combine.
- Timing of the image. This can vary from every few weeks with satellite imagery to within a few days for contracted flights. Timing is a critical factor if you plan to use the images for making in-season decisions.
- Spectral bands of the image. These will dictate the capability of the image to provide crop production information. Most common aerial imagery providers in agriculture deliver color and near infrared imagery (NIR). NIR is useful both in measuring crop health directly as well as calculating indices that allow growers to quickly identify visually weak and highly vigorous parts of a field. Although not widely available today, new sources such as thermal bands are being developed to provide more crop insights from imagery.
Comparing Imagery Sources
Satellite Imagery
- Resolution: Generally 15-60 feet per individual pixel. This results in an image with resolution similar to a common yield map. Higher resolution satellite imagery is becoming more widely available that can achieve a 3-foot pixel resolution.
- Timing: Satellite imagery in the Midwest is captured approximately every 2 weeks. Satellite imagery is susceptible to cloud cover so there are instances where it may be 4-6 weeks between useable images.
- Imagery Bands: Satellite imagery provides color and NIR bands. Many imagery providers will calculate standard indices to help approximate vegetative crop health.
- Cost: The cost of raw satellite imagery is typically less than $0.50 per acre. When delivered through a service provider with additional value services such as crop indices or interpretation, the cost can range from $0.50 to $1 per acre.
- Typical Uses: Satellite imagery has been widely used to define management zones, make fertilizer recommendations, quantify ponding or water management effectiveness, and generally assess crop vigor across a field.
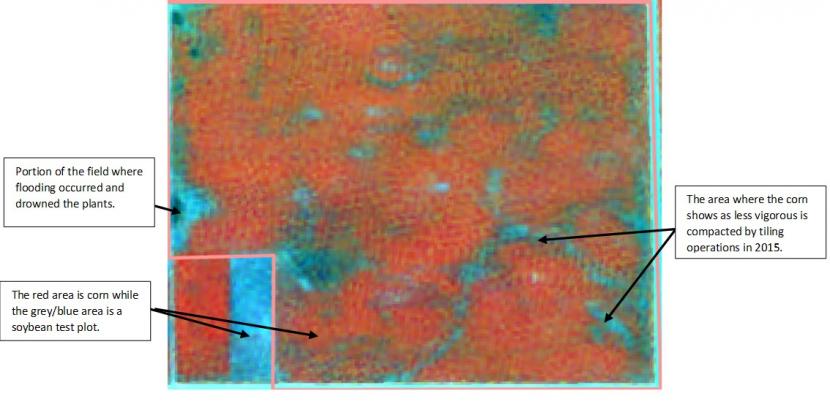
The figure below highlights the typical quality of a 16-foot satellite image of a corn field captured on July 4, 2015. The NIR map shows areas of highly vigorous crops in bright red and weak crops or bare soil in gray. In this field, we can identify the following production features: drowned out spots, possible newly tiled areas, crop identification.
Contract Flight Imagery
- Resolution: Generally 0.5-3 feet per individual pixel. Costs are typically proportional to the resolution. At 0.5-foot resolution the image will show crop health for individual rows of corn or soybeans. At 3-foot image resolution you can identify crop health in zones of two to three cropping rows.
- Timing: Contract flight services capture imagery on demand after an order has been placed and when weather permits. Generally, the image is captured within 3-5 days of the order. This quick turnaround allows contracted flight imagery to be used for in-season recommendations.
- Imagery Bands: Contracted flight imagery provides color and NIR bands. Additional specialty bands such as thermal or hyperspectral are also available from some contract flight providers.
- Cost: The cost of contract flight imagery can range from less than $2 to $5 per acre. The cost is typically driven by the resolution level and the amount of analysis or interpretation provided by the imagery supplier.
- Typical Uses: Contract flight imagery has been widely used to quantify machinery-induced crop-limiting factors, weed detection, as well as to provide higher levels of detailed assessment for defining management zones, making fertilizer recommendations, quantifying ponding or water management effectiveness, and generally assessing crop vigor across a field.
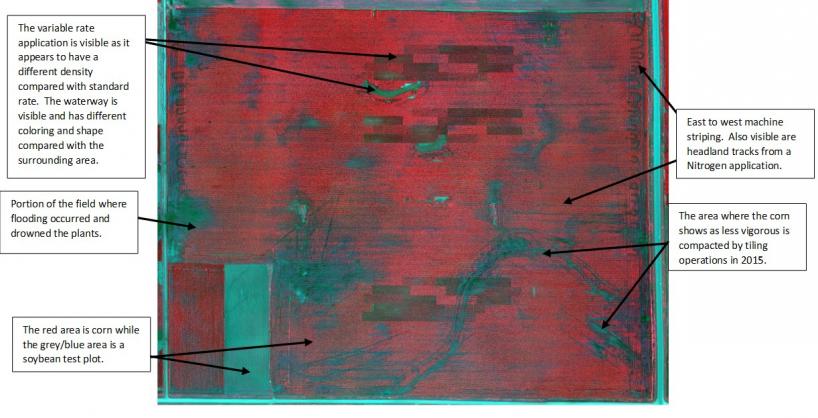
The figure below highlights the typical quality of a 1.6-foot contracted flight image of a corn field captured on July 9, 2015.
The NIR map shows areas of highly vigorous crops in bright red and stressed crops or bare soil in gray. In this field we can identify the following production features: grassed water ways, large and small drowned-out spots, newly tiled areas, and differences in soil texture, variable planting-rate applications, and east/west striping from machinery.
Fixed Wing UAV Imagery
- Resolution: Generally 1-4 inches per individual pixel. This resolution level enables individual plants to be captured in the imagery.
- Timing: UAV imagery is captured on demand. Many suppliers are able to capture imagery within a few days of a request, which easily supports using the imagery to drive in-season decisions.
- Imagery Bands: UAV flight imagery provides color and NIR bands. Additional specialty bands such as thermal are also available from some UAV flight providers.
- Cost: The cost of UAV flight imagery is highly variable in the current commercial marketplace. As the FAA implements new rules for UAV flights, it is expected that costs will become competitive with contract flight services.
- Typical Uses: UAV flights provide very high resolution imagery, which can be used for advanced features such as plant population assessment, weed detection, individual row compaction or crop performance issues, in addition to uses also provided by contract flight and satellite imagery sources.
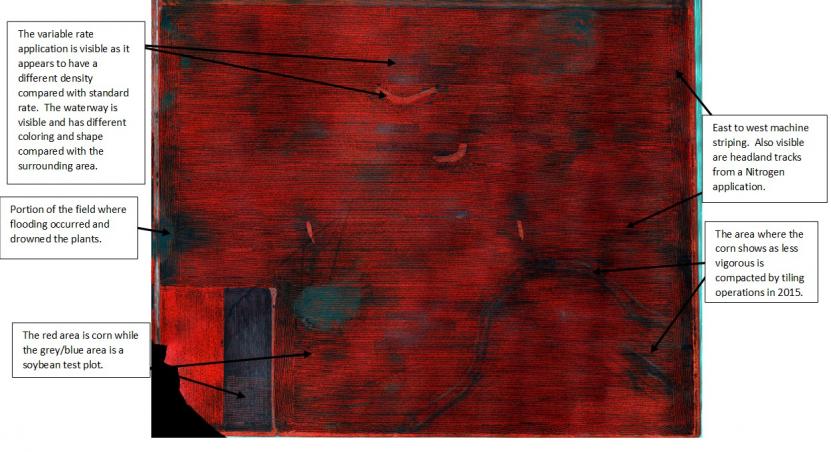
The figure below highlights the typical quality of a 0.16-foot UAV flight image captured of a corn field on June 25, 2015. The NIR map shows areas of highly vigorous crops in bright red and weak crops or bare soil in gray.
In this field, we can identify the following production features: high contrast between bare soil and healthy vegetation, grass waterways, machinery tracks, crop identification and possible areas of compaction from machinery. When viewing a full field it can be difficult to discern differences between UAV and contract flight images.
Rotary Wing UAV Imagery
- Resolution: Variable depending on the elevation of the flight. Rotary wing UAVs allow for improved crop scouting but they are not used to generate spatial maps like other imagery sources.
- Timing: UAV imagery is captured on demand. Many suppliers are able to capture imagery within a few days of a request, which easily supports using the imagery to drive in-season decisions.
- Imagery Bands: UAV flight imagery provides color and NIR bands. Additional specialty bands such as thermal are also available from some UAV flight providers.
- Cost: The cost of UAV flight imagery is highly variable in the current commercial marketplace. As the FAA implements new rules for UAV flights it is expected that costs will become competitive with contract flight services. Since Rotary Wing UAVs don’t process full-field spatial images, they generally cost less than Fixed Wing UAV images.
- Typical Uses: Rotary UAVs are ideal for getting a bird’s eye view of a field in order to prioritize crop scouting, better understand water management challenges, visualize compaction or fertility stress, and to evaluate crop establishment and vigor.
The figure below highlights the typical quality of a rotary UAV flight image captured on July 31, 2015. The color photo highlights how easy it is to detect damage in the center of a field. The damage here was caused by compaction from laying new tile lines.