Most strip-tillers understand the importance of soil testing, as they typically serve as the baseline for fertilizer and lime purchases and application.
Thanks to variable-rate technology, growers can even use soil test reports to draw up exactly where they’re going to apply a certain rate of fertilizer or lime.
But if someone were to hand you a soil test report, would you be able to read the information and understand what it means?
Most growers would probably say no. Given that fertilizer was the biggest expense for no-tillers in 2015 — more than $75,000 on average per farm, according to this year’s No-Till Farmer Operational Benchmark Study — no-tillers may want to consider learning how to read and interpret this data that can tell them what’s already in their soils.
This may become especially important because of growing concerns about nutrient runoff in local waterways. It also allows no-tillers to check for any discrepancies in their results and ensure the fertilizer recommendations their agronomist or consultant is suggesting matches what each field needs.
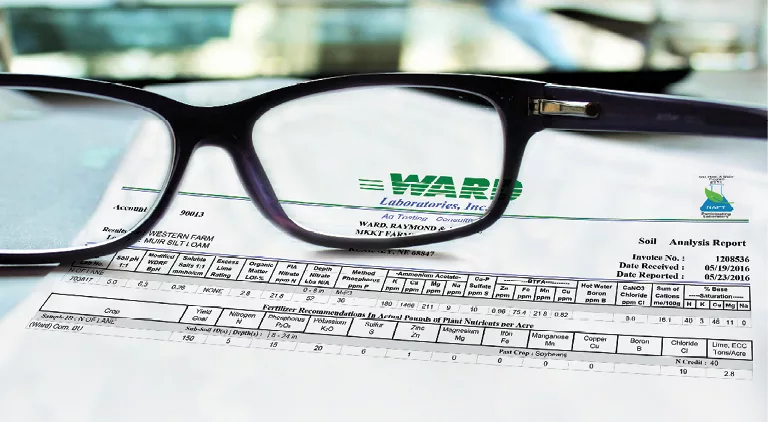
Strip-Till Farmer and No-Till Farmer editors reached out to Ray Ward, founder and president of Ward Laboratories in Kearney, Neb., who shared a recent soil test report from one of his farms and took us step-by-step through the report and interpreted it for us. You can refer to the actual report photographed above to follow along from left to right.
1. Soil pH 1:1. The 1:1 means soil-to-water.
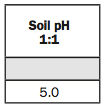
At our lab, we use 10 grams of soil and 10 milliliters of water, let it sit for half an hour and read the pH. In Nebraska, we have a state law for soil testing labs that says we have to report how we do the test. That’s why the methods are identified on our report.
A pH of 7 is neutral. As the pH drops, soil becomes more acidic, whereas if it goes up it becomes more alkaline.
In most states when the pH gets below 6, we begin to think about applying lime. And for each pH unit dropped, like from 7 to 6, the hydrogen-ion concentration — which determines acidity and alkalinity — increases 10-fold.
This pH is 5.0, so we’ve dropped 100-fold in hydrogen-ion concentration, which means it needs to be limed as soon as possible.
2. Modified WDRF BpH.
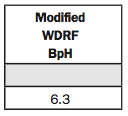
The WDRF stands for Woodruff, who was a soil scientist at the University of Missouri who developed a buffer method that we use in our laboratory because it estimates lime needs on sandy soils better than the SMP Buffer developed at Ohio State University.
The difference between the buffer pH and the soil pH is the buffer pH measures the total acidity in the soil, while soil pH gives us the active acidity.
We use the buffer pH to determine how much lime to apply. We take 7 minus the buffer pH and multiply by 4 to arrive at the lime recommendation of 2.8 tons per acre, which you can see under the fertilizer recommendations listed in the sidebar on page 35.
That recommendation is what I call 100% effective lime. Most ag lime is 60% effective lime, so you would take 2.8 and divide it by 0.6 to come up with the amount of ag lime you need to apply, which brings us to 4.7 tons per acre.
3. Soluble Salts 1:1 mmho/cm.
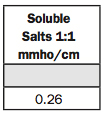
This is an electrical conductivity reading or EC reading. We still use the old term mmho/cm. The new term is mS/cm, but it’s the same.
Because we’re in the western part of the Corn Belt, there are more saline soil conditions out here, and so we run EC on every sample. Because if we have a saline problem, we know it right away.
I also use the EC reading in reviewing the soil results because if I have a very high nitrate, sulfur, calcium or potassium (K) reading, I can look at the EC. If it’s higher, then I know the soil test was run correctly. When the plant nutrient levels get too high, the soluble salt readings will increase.
If the soluble salt or EC reading is above 1.5, we have a saline condition. But if you’re really low, it means you don’t have much life in your soil. So you’d like to have that soluble salt reading around 0.3 to say you have a good, living soil.
If you’re above 0.6 or 0.7, then you have to look around and see what’s causing it to be out of whack, whether your nitrates or sulfates are too high, or something else is too high.
4. Excess Lime Rating.
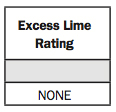
This is a way of determining if you have a calcareous soil, which is one that has free lime in it. And in the Plains and mountain region, we have a lot of calcareous soils. It’s just a way to let the farmer know, ‘Hey, this soil may have iron deficiency chlorosis’ or something like that.
In the past, when we had more triazine-type herbicides, some were very sensitive to high pH or high lime, so we needed it to adjust the triazine herbicide rates. Well, those are almost all gone now except for atrazine, so we don’t worry about it too much. It still might be important in some herbicide applications, though.
The “none” indicates that the pH is probably less than 7. It’s possible you could have a soil pH of 7-8 and no excess lime. But you should not have any free lime if the pH is below 7. And if I see that when I’m reviewing results, I ask that the soil tests be checked again.
5. Organic Matter LOI-%.
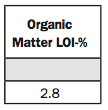
The LOI stands for “loss on ignition,” which is how we determine how much organic matter is present. We dry the soil and weigh it, then we place it in the muffle furnace at 360 C, or 680 F, and that burns the organic matter off. Then we cool the samples and weigh them again. The difference between the two weights is the amount of organic matter that was present.
The important thing for farmers to understand is that each percent of organic matter contains at least 1,000 pounds of nitrogen (N) per acre in that 0- to 8-inch depth. This test has a 2.8%, so that’s 2,800 pounds of organic N stored in the top 8 inches of soil.
We’re trying to build up organic matter to make it better for the water-holding capacity, and it also helps us build nutrient levels. All the nutrients in plants are in organic matter. In really good conditions, we can get more out of the crop because we have higher organic matter.
6. FIA Nitrate ppm N and Depth Nitrate Lbs N/A.
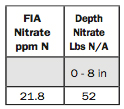
FIA stands for “flow-injection analysis,” which is the method we use to determine the nitrates.
Nitrate is soluble, as we know, and it leaches if there is too much rain. But nitrate is available and we can quantify it. We can calculate pounds of N per acre, which we find in the next column.
We take the depth of the soil, which is 8 inches, multiply it by 21.8 ppm NO3-N and then multiply by 0.3. The 0.3 comes from the weight of the soil — each inch weighs 300,000 pounds per acre, which equals 0.3 million. This calculation gives us 52 pounds of nitrate per acre.
7. Method Phosphorus ppm P.
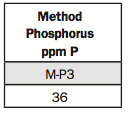
The M-P3 underneath stands for a phosphorus (P) extract developed by North Carolina State University soil scientist Adolf Mehlich. This test is used by many soil-testing laboratories in the Plains and to the East.
We consider anything above 25 ppm high. We can see it’s above that, so you wouldn’t have to apply any P for a year or two. But we do recommend a starter fertilizer application of up to 50 ppm P.
For the irrigated or really high yield potential areas, like 250-bushel corn, I’d like to see that up to 35-40 ppm.
8. Ammonium Acetate: K, Ca, Mg, Na.
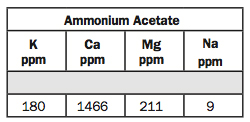
Ammonium acetate means they’re exchangeable cations. K stands for potassium, Ca is calcium, Mg is magnesium and Na is sodium.
For most states, 180 ppm for K would be rated as high. Probably anything above 150 or 160 ppm K is high. If you’re above 160, you can likely go without it.
But we like to see 200 ppm K for corn, which is why we recommend adding 20 pounds of K2O per acre under the fertilizer recommendations (see sidebar, page 35). We’re just telling the farmer to put a little bit on to maintain the soil test where it is.
Calcium is at 1466 and I don’t have a rating for calcium. Some people like to look at the base saturation (No. 14) on that and say it’s too low. That’s because the pH is very acidic. As the pH drops, normally hydrogen ions will replace calcium ions on the exchange complex and the calcium ions leach.
Magnesium is 211 ppm. We recommend magnesium application if the ppm gets less than 50 ppm. So if it’s above 50, we consider that high.
And for sodium, we want low sodium. Sodium is bad for the soil. A lot of people associate sodium and salt together. Sodium is called a sodic soil and salts are called a saline soil. So there’s a big difference in the terminology.
A high sodium ppm level is calculated by multiplying the CEC (No. 13) by .05 by 230. Sodium base saturation should be below 5% CEC.
9. Ca-P Sulfate ppm S.
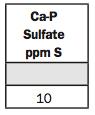
Ca-P is a calcium phosphate solution we use to extract sulfur. Sulfate is like a nitrate; it’s soluble and moves around with the water.
If we’re below 12 ppm, we might consider putting sulfur on — partly because our atmosphere is so clean now we don’t get much free sulfur anymore. So we recommend a little bit of sulfur on this corn (see sidebar, page 35), because we’re below 12.
10. DTPA: Zn, Fe, Mn, Cu.
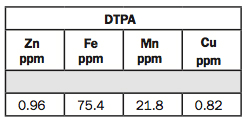
DTPA is a chelate used to extract zinc (Zn), iron (Fe), manganese (Mn) and copper (Cu). Willard Lindsey at Colorado State University developed the test in the 1960s.
If you’re above 1 ppm zinc, you’re probably OK. Some agronomists like to go to 1.5 instead of 1, but I believe 1 is adequate.
Iron is more soluble as the pH becomes more acidic, and this is a low pH, so the iron test is very high. We want the iron test above 4.5 ppm. If it’s below 4.5, and you have a pH above 7, and high excess lime, you likely have iron deficiency chlorosis (IDC) problems.
For manganese, I want it above 3 ppm. Willard Lindsey’s was 1. I’m not as sure about manganese as the other micronutrients.
On copper, we have 0.82 ppm, and we like to see it above 0.20.
11. Hot Water Boron ppm B.
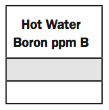
We run boron sometimes, but we didn’t for this test because it has been high in the past.
On corn and soybeans, we like to see it above 0.25 ppm. For alfalfa, sugarbeets and cotton, we go up to 0.5 ppm. But the rest we keep at 0.25. That’s based on Oklahoma State University calibrations.
12. CaNO3 Chloride ppm Cl.
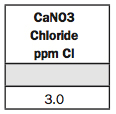
This is chloride and it’s an ion that has been found deficient in South Dakota and Kansas the last 20 years. In Kansas we like to see the chloride test above 6 ppm, so the 3 is a little bit low. We’d recommend some chloride.
Chloride is very important for the grasses like wheat, milo and corn, but not so important for the broadleaves like soybeans.
13. Sum of Cations me/100g (CEC).
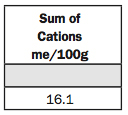
This is an indication of texture and the amount of organic matter in the soil. The clay and organic matter provide the CEC, and then the type of clay also affects the CEC or the sum of cations.
The kind of clays we have here in the Plains are much higher in cation-holding capacity than the clays in the Southeast. So you can’t really tell the texture unless you know the location of the soil. But 16.1 would indicate a silt-loam soil, and this soil is in fact a Muir silt loam.
14. % Base Saturation: H, K, Ca, Mg, Na.
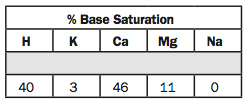
Now we’re on the percent base saturation. H is hydrogen and it’s at 40%. I’d like to see that below 30%. If it’s below 30%, I’d say you can get by another year without lime. But at 40% we need to put some lime on.
For K, I’d prefer to look at the K soil test instead of the base saturation. We’re just on the border with 3%. I think some people would say it needs to be 5%.
Calcium is 46%. It’s obviously low because the hydrogen is high. If we apply lime, the calcium will replace hydrogen. Some people like to see 60% or 65%.
Magnesium is at 11%. We’re plenty high in magnesium at 211 ppm (No. 8). So I’m not too worried about that.
And then sodium is zero, which is great. If the sodium is above 5%, then we need to be thinking about applying gypsum to reduce it. Gypsum is calcium sulfate, and calcium replaces sodium and it moves down with the sulfate ion. Calcium replaces sodium on the exchange complex.
And because of the size of the ions — sodium is a bigger ion in the soil in hydrated conditions — it’s easier to remove. So calcium kind of kicks it off the exchange complex.
Because we’re in the Plains states, we run sodium on everything when we run the cations. Sometimes sodium is a problem. If it’s above 5%, it begins to become a problem. And by the time it’s 15%, it’s a real problem.
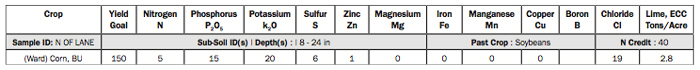
Fertilizer Recommendations in Actual Pounds of Plant Nutrients per Acre
Ward Laboratories founder and president Ray Ward shared the fertilizer recommendations for the soil test report (see page 30). While most of the numbers are straightforward, he explains how they determined the nitrogen (N) recommendation:
“We provide up to three fertilizer recommendations if the grower requests it. It can be one crop with three different yield goals or three crops and their respective yield goals.
“The subsoil number on the second line takes into account the subsoil nitrate test. It doesn’t show it, but the nitrates in that 8- to 24-inch depth was 14.9 ppm. It’s not mentioned on here, but that accounts for 72 pounds per acre. Combined with the 52 pounds in the topsoil, we have 124 pounds of N per acre.
“Corn uses 1.1 pounds of N per bushel. The yield goal is 150 bushels, so the corn requires 165 pounds of N per acre. Subtract the 124 we already have and it requires an additional 41 pounds per acre. We round to the nearest 5, so our recommendation would be 40.
“But if you had soybeans in there last year, as this report indicates, we subtract 40 pounds. We account for legumes in the rotation. I haven’t figured out how to do that yet for cover crops, but it’s important to evaluate the N supply by either the past legume crop or by the cover crop.”