Introduction: Nitrogen fertilizer is an important nutrient required by all crops for growth and development. Nitrogen is required for early development of stems and leaves and the seeds need Nitrogen to produce proteins. Since Soybeans contain approximately 30% protein, they require 2-3 times more Nitrogen fertilizer than wheat, which has a protein content of 10-15%. Corn has only 8-10% protein, however the yield for corn is such that a larger amount of Nitrogen fertilizer is required to reach the full yield potential. As such, understanding the uptake and availability of Nitrogen for growing corn and Soybeans is extremely important.
There are several mechanisms to measure Nitrogen, but they refer to different times of the plant growth cycle. Measuring Nitrogen in the soil prior to planting is performed by taking soil samples and analyzing them in a laboratory. The cost of laboratory analysis of soil samples is between $40-70 per sample. To adequately sample a field of 500 acres, 50 samples should be collected, i.e., 1 sample per 10 acres. Generally far fewer samples are collected across a field because the cost is prohibitive and the time between sampling and analyses can be 2-3 weeks.
Estimates of the effects of Nitrogen fertilization can be performed using Satellite Imagery and using the Normalized Difference Vegetation Index (NDVI). Farmers can use the NDVI information to apply more fertilizer during the plant growth cycle in order to increase yield or to address any deficiencies in zones where the plant growth is N limited. However NDVI is more a qualitative measurement, i.e. relative data, which has to be ground proofed by taking leaf tissue samples and analyzing them in a laboratory.
In the last four years, in field testing of the protein in corn and Soybeans using an on combine NIR analyzer has provided another means of measuring Nitrogen uptake and availability across the field. As compared with soil sample analyses and NDVI imagery, on combine NIR analysis provides a quantitative measurement of the amount of Nitrogen and Sulfur that has been taken from the soil by the plant in the form of protein. As such this data is a new layer of information that can complement both soil testing and NDVI to help farmers balance yield across fields, to increase yield and protein, and to better diagnose what is happening to the fertilizer applied in the field.
Plant Growth Cycle
All life has an objective to reproduce itself. Plants produce seeds in order to shed then and therefore raise new plants. Although plants do not have a brain, they are genetically coded to optimize the potential for the plant to reproduce itself. Corn, wheat, barley and other plants that produce a head or cobs to carry the seeds, will abort heads or cobs if there is insufficient nutrients to ensure that the plant will reach maturity, produce seeds and shed them. Soybeans grow in a pod, but still the numbers of pods that come to maturity are dependent on the availability of nutrients throughout the vegetative and reproductive stages of development.
Yield is normally defined as the mass of grain produced per acre or hectare. The yield is primarily determined by the number of heads, cobs or pods that reach maturity. If the plant needs to abort the tillers in the early stages of the vegetative growth phase then the remaining number of tillers will define how many heads, cobs or pods will come to maturity.
Once the yield potential has been set by the number of tillers, no matter how much nutrients the farmer adds to the crop, it will not recover the lost the yield potential. If the plant has produced a full complement of tillers then it will produce seeds depending on the availability of nutrients during the reproductive stages. Insufficient nutrients will result in the heads, cobs or pods being aborted or if retained, will have not been completely filled to maturity.
Nitrogen, Sulfur, Phosphorous and Potassium are required throughout the growth cycle. Figure 1 shows the stages of the growth of corn from emergence to maturity. Approximately 180lb of Nitrogen and 30lb of Sulfur are required to produce 300 bushels of corn. Soybeans require approximately 5lb of Nitrogen per bushel of seeds.
Nitrogen and Sulfur are taken up as Nitrate and Sulfate by the plant and are produced by the bacterial breakdown of organic matter in the soil, or by addition of fertilizers. Historically Sulfate ions have been introduced into the soil due to acid rain. However in recent decades the amount of Sulfur Dioxide released from coal fired power generation has dramatically reduced and this has resulted in less acid rain deposits across the USA. It has now become important to replace the Sulfate taken from the soil in the form of protein through Sulfate fertilization. Soybeans require Nitrogen in the early vegetative stages of growth as well as the reproductive stages. However Soybeans, a legume, source Nitrogen differently from corn. In the early vegetative stages of growth, Nitrogen from the air is fixed by bacteria found in nodules on the roots. In the reproductive stages, Nitrogen can be sources from the soil as well as by fixation.
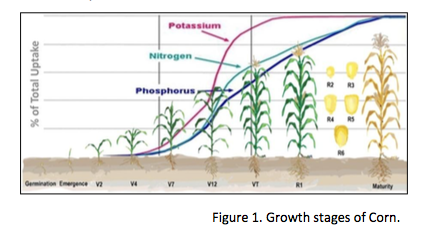
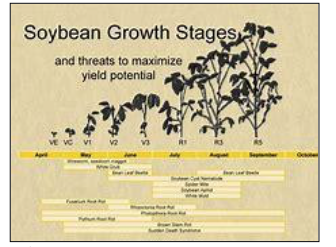
Figure 2. Growth Stages of Soybeans.
Nitrogen is an important component of the biomolecules that are involved in cell functions. Enzymes are the chemical machines that breakdown and build up biomolecules, which are used for making proteins, sugars, vitamins, etc. within the cells. Photosynthesis takes Carbon Dioxide from the air and turns it into sugars. Nitrogen is a key element in the biomolecular pathways involved in photosynthesis. Sulfur is also important in photosynthesis. Sulfur is also important because it assistance the enzyme, Nitrate Reductase, to breakdown the nitrate in the cells to Nitrogen which can then be used by the cells within the plant. Nitrogen and Sulfur are important elements in plant proteins because they are present in the amino acids, which make up proteins. Deficiency in Nitrogen will result in less proteins being produced in the seeds. In corn, deficiencies in Nitrogen can result in changes to the amino acid profile, especially lysine and threonine. Deficiency in Sulfur will result in certain proteins not being produced by the seeds at all.
Real-Time Measurement of Protein in Corn and Soybeans
Proteins in corn make up about 9% by weight of the corn kernel. 16.5% of the protein by weight is Nitrogen and 3.5% is Sulfur. So for every 100 bushels of corn harvested, i.e., approximately 1lb of Nitrogen and 1/6lb of Sulfur are removed from the soil. Likewise soybeans contain approximately 30% protein by weight and for every 100 bushels of soybeans harvested then approximately 3lb of Nitrogen and 1/2lb of Sulfur are removed from the soil.
Unlike wheat and barley, there are no premiums paid for protein in corn and soybeans. However it has been rumored that the US Soybean Growers Association is looking into paying farmers a premium for protein to encourage them to increase the protein content in their soybeans. Evidently US soybeans have been reducing their protein content for many years and this is affecting their market acceptance against Brazilian soybeans. Historically, soybeans do not benefit from Nitrogen fertilizer in terms of yield increase, however protein content in the final seeds can be increased with application of Nitrogen fertilizer in the reproductive stage of the plants development.
As for corn, there is little reason to increase protein in corn, however protein content is an indicator of the maturity of the kernels. Increasing nitrogen supply to corn generally results in increased grain and protein yields and increased grain protein concentration. However too much Nitrogen can result in a reduction in the nutrient value of the corn.
Protein is synonymous with Nitrogen and Sulfur and as such measuring protein in both soybeans and corn provides information as how Nitrogen and Sulfur were used by the plant during the Vegetative and Reproductive stages of development. Since the protein produced in the seed carries the genetic information and the enzymatic mechanisms required to reproduce the plant, the amount of protein in the seeds indicates that the plant has reach maturity and that the plant is fully equipped to shed its seeds. Plants that do not have the optimal protein content, may not have reached their full yield potential.
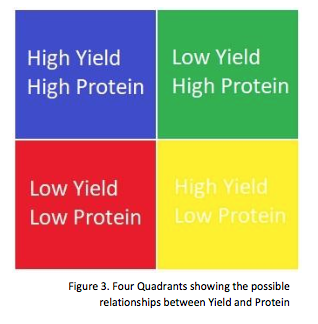
Figure 3 shows four quadrants that identifies the possible relationships between Yield and Protein.
The causes for each scenario include:
- High Yield/High Protein: Sufficient Nitrogen available during the Vegetative and Reproductive stages. Most likely the Yield was optimal.
- Low Yield/ High Protein: Insufficient Nitrogen in the Vegetative stages yet sufficient Nitrogen in the Reproductive stages.
- Low Yield/Low Protein: Insufficient Nitrogen during both the Vegetative and reproductive stages
- High Yield/Low Protein: Sufficient Nitrogen in the Vegetative stage however something has stopped or limited the Reproductive stage. The Yield may have been higher if the cause of the stress in the Reproductive stage were uncovered.
The CropScan 3000H On Combine Analyser (Next Instruments, Sydney, Australia) measures protein, moisture, starch, fiber and oil in corn and soybeans as they are stripped in the field. The system consists of a Remote Sampling Head, a NIR Spectrometer and a Touch Screen PC controller. The Remote Sampling Head is mounted to the clean grain elevator of a combine harvester. As the grain flows up the clean grain elevator, a small portion drops into the Remote Sampling Head where it is trapped between two windows. NIR light is passed through the sample of grain and carried by a fiber optic cable back to the NIR Spectrometer that sits inside the cabin. The NIR Spectrometer measures the amount of light that is absorbed by protein, moisture, oil, starch and fiber. The amount of light absorbed by each component is proportional to the concentration of the component. The Touch Screen PC displays the data in the form or tabular data, field maps and trend graphs.
The sample of grain is released into the downside of the clean grain elevator and returns to the tank. The process takes around 12 seconds depending on the flow of the grain into the Remote Sampling Head. GPS coordinates are taken from the on board GPS transponder and recorded along with protein, moisture, oil etc. A data point is displayed in the real-time field map at approximately every 40 feet as the combine travels down the row. F
When the out loading auger is activated, the system takes the average protein, moisture, oil, starch and fiber for the tank load of grain and sends the data to the Cloud for access by the farmer using a Smart Phone, Tablet or PC. The operator can specify into which field bin the grain can be stored in the field. Then a Blending Calculator can be used by the operator to direct the grain cart driver on how to blend the grain based on protein in order to get the optimum grade.
Examples of Corn and Soybean Field Maps:
Figure 6 and 7 show field maps for protein for soybeans grown in Brandon, Manitoba, Canada in 2017.
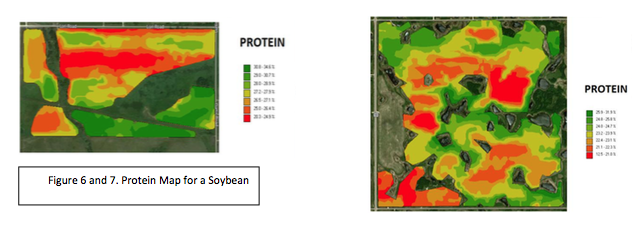
The variation in protein across the two field is quite large, i.e., 20-35%. Since protein is a direct indicator of the performance of the crop, these maps show that the red zones are potential areas where the yield may not have reached its full potential. Whereas the green zones show where the yield and protein have reached the optimum balance.
Figures 8, 9, 10 and 11 show the protein, oil, moisture and starch maps for a corn field in western NSW, Australia.
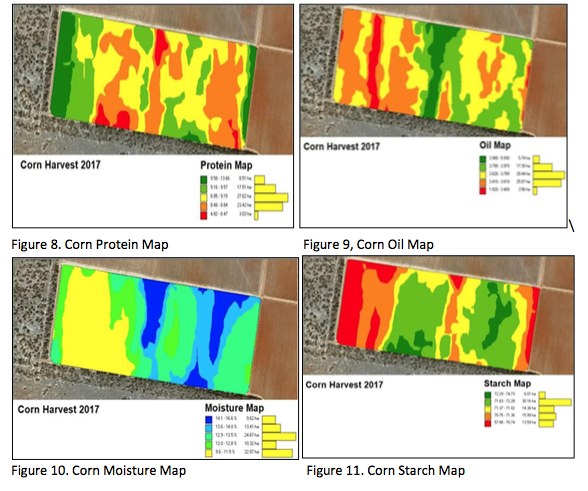
The protein map shows that only 2/3rds of the field has a protein level between 8-10% which is the optimum for corn. The red zones are potential areas where the yield potential has not been achieved.
Unfortunately the yield data was not available for these fields. If available, then Nitrogen and Sulfur Removal Maps could be generated. These maps could be beneficial in providing greater insight into the Yield/Protein balance required to achieve an optimum Yield.
Discussion
Protein measurements in the field provide layers of information that have not been available up till now. The availability of on combine NIR analysis provides an understanding of the uptake and availability of Nitrogen and Sulfur in the plant during the Vegetative and Reproductive stages of plant development. By optimizing the application of Nitrogen fertilizer, it will help farmers to increase their yield and grain quality. It will also help farmers reduce their fertilizer costs and to reduce the potential of Nitrogen run off into rivers and aquifers.