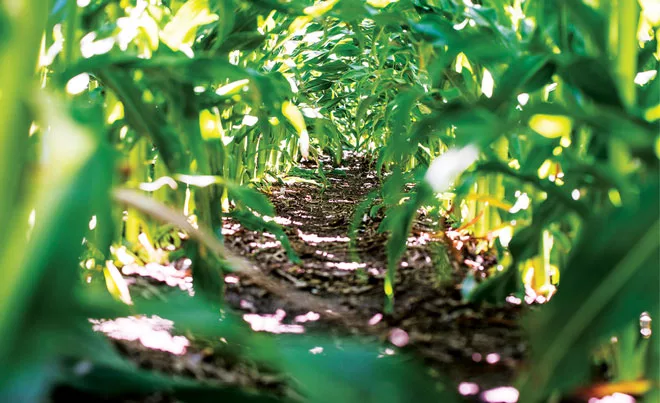
Pictured Above: GROWING PRACTICE. Results of the 2017 benchmark study evaluating 2016 cropping practices confirmed consistency in several foundational practices, including size and setup of strip-till rigs, along with seeding rates for both corn and soybeans. But analysis also revealed some interesting shifts in strip-tillers’ cover crop and fertilizer preferences, compared to prior years.
Strip-till is an imperfect farming practice and some variables can’t be conquered. But strip-tillers can curb the impact Mother Nature has on their crops with a flexible, progressive system in place, which may include a customized cover-cropping strategy, well-timed strip building and use of implement guidance.
All three areas saw growth during the 2016 cropping season based on analysis of the 4th Annual Strip-Till Operational Benchmark Study. A record 446 farmers from 20 states and Canada who identified themselves as strip-tillers responded to the 40-question survey issued by No-Till Farmer’s sister publication, Strip-Till Farmer.
Results of the 2017 study evaluating 2016 cropping practices confirmed consistency in several foundational practices, including size and setup of strip-till rigs, along with seeding rates for both corn and soybeans. But analysis also revealed some interesting shifts in strip-tillers’ cover crop and fertilizer preferences, compared to prior years.
The collective techniques being applied by strip-tillers proved especially productive in 2016, with a nearly a 10 bushel per-acre bump in average corn yields compared to the past two benchmark studies, and a nearly 5 bushel per-acre bump in soybean yields over 2015 data.
In the following pages, we compare and contrast the 2016 cropping practices, equipment and technology strip-tillers are utilizing in their operation with prior years, while also evaluating the specific fertilizers, cover crops and precision tools strip-tillers are utilizing in their operation.
We again crunched the numbers on the top 10% of respondents by corn yield (average of 250 bushels per acre) and soybean yield (average of 72 bushels per acre) to see what strategies are separating them from the pack.
More Strip-Till Benchmark Study Analysis
Dig deeper into equipment setup, strip-building preferences, fertilizing practices and precision farming usage in extended online analysis from the 4th Annual Strip-Till Operational Benchmark Study. Learn about which strip-till rig and GPS correction signal brands are most popular, as well as when and what types of nitrogen, phosphorus and potassium strip-tillers are applying in their operation.
Row Cleaners, Fertilizer Boxes, RTK are Popular Strip-Till Choices
Stability in Size, Setup of Equipment, Separation in Timing of Field Preparation
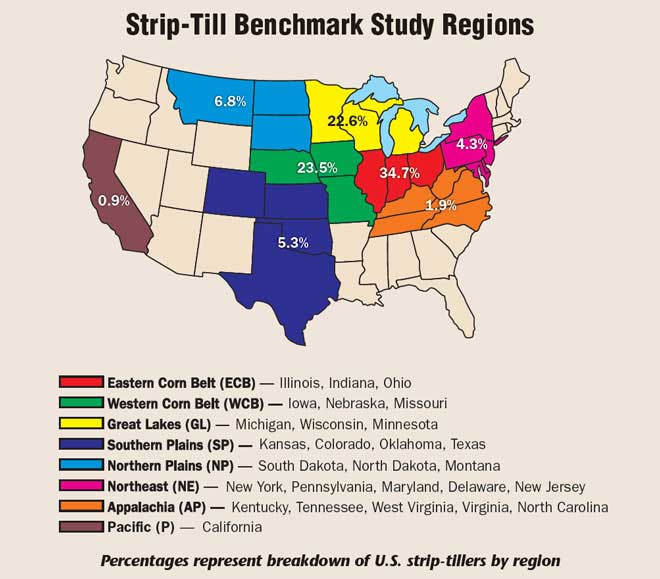
Geographic Clout
Breaking down study participants by region, the Corn Belt maintained its stronghold with 80.8% of strip-tillers — up nearly 2% from last year — located in the Eastern Corn Belt (34.7%), Western Corn Belt (23.5%) or Great Lakes (22.6%) region.
For the third year in a row, Illinois led the way with 90 respondents — 22 more than last year’s study — followed by Iowa with 69 and Minnesota with 47. Rounding out the top states represented in the 2017 study were Ohio (25), Wisconsin (24), South Dakota (18), Indiana (18) and Nebraska (17).
While Midwestern states continue to populate the top strip-till locations in 2016, two other regions gained ground; the Northeast (New York, Pennsylvania, New Jersey, Maryland) increasing from 2.6% to 4.3%, and Appalachia (Kentucky, Tennessee, West Virginia, Virginia) from less than 1% to 1.9%.
Evolving Experience
Both youth and inexperience were well-served in last year’s study, with 21.6% of respondents under 35 years old and 38.3% under 45. Some 42.7% of respondents reported being strip-tillers for less than 5 years, while 27.9% had been strip-tilling at least 10 years, the smallest number in 3 years.
But this year’s study revealed an interesting dynamic, skewing a bit older and more experienced. Some 46.3% of respondents are 55 or over. Compared to 43.9% last year and 19.1% reported strip-tilling at least 16 years, a record high in the 4-year history of the benchmark study, including 9.9% who strip-tilled more than 20 years.
On the other end of the spectrum, 36.2% said they have been strip-tilling less than 5 years, compared to a high of 42.7% in last year’s study.
It will be worth watching to see if the transition continues to take hold in the coming years and how the next generation of strip-tillers will evolve their on-farm methods. Also, only 1.4% are under 25 years old, another record low and continuing a 3-year downward trend.
The Top 10%
Midwestern dominance was reinforced by the top 10% of strip-tillers participating in this year’s benchmark study. Some 95% of the top strip-tillers were from either the Eastern Corn Belt (42.5%), Western Corn Belt (37.5%) or Great Lakes (15%) regions.
Also noteworthy is that the 42.5% of the top yielding strip-tillers from the Eastern Corn Belt is nearly twice the percentage of last year’s study (21.9%), while the total from the Western Corn Belt dropped about 7 points from last year’s results.
On the state level, Illinois led the way with 15 of the top 40 (37.5%), more than the combined total of the next two highest states, Iowa and Nebraska, with 7 each. Last year, Nebraska led the way with 25% of the top-yielding strip-tillers.
Overall though, 9 different states were represented among the top 10% of strip-tillers in the 2017 study.
Looking at the age breakdown, the majority (69.2%) of the highest yielding strip-tillers are at least 45 years old, including 46.1% who were 55 or older. Unlike last year, this equated to more experience in the practice.
Some 42.8% of the top strip-tillers have been strip-tilling at least 11 years, including 10.2% for more than 20 years. Only one third (33%) have been strip-tilling 5-10 years, down from 50% in last year’s study. However, the number strip-tilling less than 5 years increased from 21.2% to 25.6% in this year’s study.