Farming for short-term yield will be different than long-term soil benefit.
That’s not a new idea, but it has been driven home by 18 years of research spearheaded by researcher scientists Alan Moulin and Taras Lychuk of Brandon’s Agriculture and Agri-Food Canada research station.
From 1994-2003, the pair’s team cross-compared organic, reduced- input no till, and high-input management with three 6-year rotations. There was a low-diversity rotation of wheat and summerfallow, plus one year of canola, diversified annual grains (which mixed canola, fall rye, peas, barley, flax and wheat) and an annual-perennial mix, which took canola, wheat and barley and finished off the rotations with three years of alfalfa.
High inputs largely echoed conventional agriculture, while reduced-input systems applied fertilizer according to soil tests and yield goals and herbicides were applied to manage weeds.
Where’s the Balance?
For the Scott, Sask. research site, Moulin and Lychuk found that reduced inputs and a rotation of diverse annual grains rose to the top on their list of combinations.
“This combination may offer a sustainable solution, at least for that particular location we were looking at, in terms of soil organic carbon contents, the crop yield, nitrogen and phosphorus,” Lychuk says.
Limiting inputs made for the lowest nitrogen losses and highest phosphorus content, while reduced tillage, increased cropping frequency and “appropriate combinations of fertilizer input and diversified cropping” helped build carbon and organic matter and maintain soil nutrients.
“I’m not saying that following the zero tillage and including grain crops in the production will be a 100% solution for farmers to pursue in the future,” Lychuk adds. “It will just help alleviate the negative impacts of climate change on crop and environmental quality in the region.”
At the same time, the mix promised to be the most economical.
High inputs gave the most raw yield out of the three management systems and, within that system, low diversity and annual grain rotations outperformed the annual-perennial mix. Reduced-input no till, however, was close behind. The lower inputs averaged 95% of high-input yields in wheat.
Organic plots dropped behind with only 77% of high-input yields, a pattern that would repeat throughout the study.
Results were similar in barley, but yields leaned more towards diversification. Both annual grains and annual-perennial crops yielded high when mixed with the two highest input levels.
The study noted, however, that yield increased in all three input systems over time.
Downside
Soil quality data was not as kind to conventional agriculture.
Data from the second cycle (2001-06) found that fallow systems, like in any form of the low-diversity rotation or organic annual grains, had more nitrate in the 90-centimeter-deep rooting zone and more leaching into the subsoil.
High-input systems had a similar problem. Plants didn’t need or use the amount of nitrogen fertilizer added, which also increased nitrate in the rooting zone, the study found, although some years showed little nitrate difference between high- and reduced-input soil nitrate.
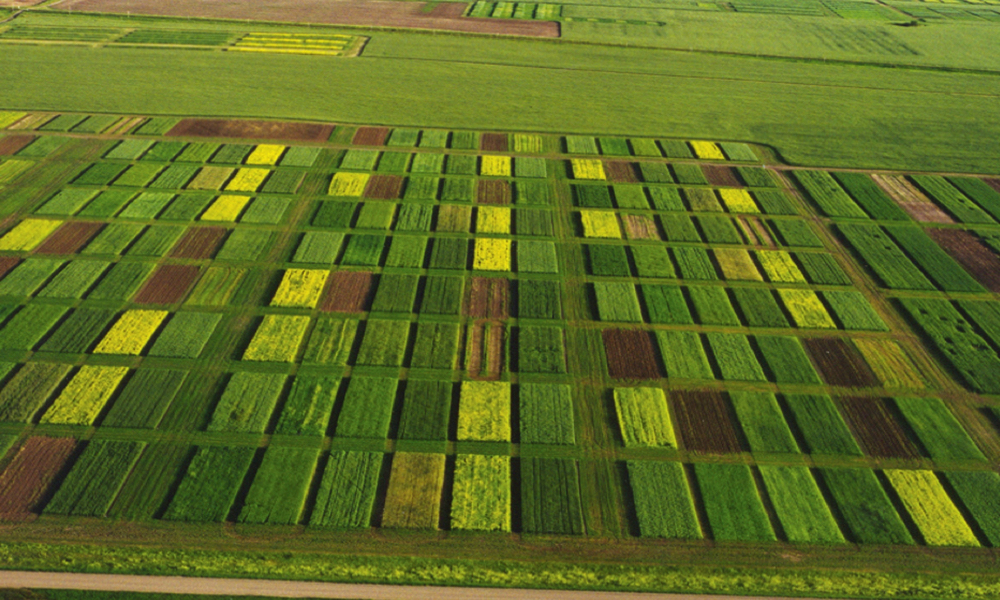
Plots test different combinations of inputs and rotation diversities during an 18-year study at Scott, Sask (Photo Credit: Dr. Alan Moulin)
High-input plots averaged 84.7 kilograms of nitrate in the first 90 centimeters of soil from 2001-06, while reduced input and organic sat at 76 and 74 kilograms per hectare respectively.
“Our results suggest that conventional soil testing is not robust enough to detect over-application of fertilizer N, particularly during dry cycles,” the study’s final report reads. “Under such conditions, some mechanism is needed to adjust recommended fertilizer rates downward to account for this.”
Carbon, likewise, favored reduced-input no till, in no small part due to the reduction in tillage.
The lower-input system averaged 36 grams of aggregate organic carbon per kilogram of soil, compared to 31 grams per kilogram in high-input plots and 30 grams per kilogram in organic.
There was no impact on total organic carbon across either inputs or rotations, but light fraction carbon, light fraction organic matter and light fraction nitrogen were all highest in reduced input and, within the three rotations, in annual grains and annual-perennial plots.
“Light fraction carbon accumulates at the surface of reduced tillage because the roots and the crop residue aren’t mixed thoroughly into the soil,” Moulin says. “In organic systems, with cover crops, that’s a different equation.”
Soil Stability
Reduced-input plots had the highest wet aggregate stability (54.4% compared to 42.6% in conventional plots and 40% in organic), something Moulin attributed to less tillage. Both annual grains and annual-perennial rotations (46.9% and 46.3%, respectfully) beat out low-diversity plots’ 44.3% aggregate stability.
The study did not take organic cover crops into account, Moulin added, something that might add into the soil health equation when comparing reduced input and organic systems in the field today.
For Stephen Crittenden, one of the Brandon research stations’ experts in nutrient management and soil health, the study’s results become a matter of long-term versus short-term gain.
“Researchers looking at soil health might say that sometimes producers might take a hit in terms of yield in the short term,” he says.
Crittenden, who has delved into reduced tillage and is currently looking at biological soil health indicators like water movement, soil carbon, organisms like earthworms and water infiltration, argues that building soil health and soil structure will add capacity to the system and better buffer against environmental changes.
“These are indicators which, over the long term, the idea is they will build resistance to change,” he says. “So if they have a drought year and yields go down, you hope that the management practices that you implemented to try and improve your soil health will, in that case, give you a better yield.”
Organic’s Nutrient Struggle
Organic systems were generally nitrogen and phosphorus deficient.
Organic plots averaged 19 kilograms of extractable phosphorus per hectare in the first 90 centimeters of soil from 2001-06, compared to an average 24.3 kilograms per hectare in high-input systems and 25.5 kilograms per hectare with reduced input. Phosphorus was as high or higher in reduced input as in conventionally managed plots.
“One fundamental process in agriculture is that if you don’t add nitrogen and phosphorus and you continue to crop the soil, you’re going to remove nitrogen and phosphorus,” Moulin says. “So mining the soil in a system without replacing those plant nutrients will certainly reduce nitrogen and phosphorus in the soil. Other systems that use fertilizer and soil test recommendations for fertilizer will maintain nitrogen and phosphorus in the soil. That said, with organic systems — if you have a system that has green manure, for example — green manure can fix nitrogen and that nitrogen will be added to the soil and certainly reduce the loss of nitrogen.”
The study noted green manure helped limit both nitrate in the rooting zone and leaching, since the crop stored nitrate and used up more water that would have otherwise drawn the nutrient down.
Legumes and composted manure also helped make up for removed nitrogen, although Moulin’s team warned that organic producers should be on the watch for dropping nutrients.
Environmental Factors Important
Farmers can play with combinations of inputs and rotations, but it might not matter in wet or dry years, Moulin and Lychuk says.
In both of those cases, environmental factors like terrain and rains took the lead.
“It has nothing to do with your inputs or crop diversity in that particular year,” Lychuk says. “That’s why we were looking at many years of simulations in climate change so that we can get a better signal based on average by averaging out the dry spells and wet spells in the long-term yield and N (nitrogen) and P (phosphorus) and carbon.”
Despite elevation varying only 3.5 meters across the field, the Scott study found that only 56% of yield variation could be explained by input or diversity in 1998, the driest year of the study and terrain featured heavily into the difference. At the wettest point in 2010, about 66% could be explained by input and diversity and in 2005, when crops were following a wet year, almost all wheat yield variation was attributed to terrain.
Likewise, a “primary yield driving factor” in the study was not input or diversity, but April rain. The early precipitation was cited for 18.5 % of total yield variation and, when combined with June rain, accounted for more yield variation than input and diversity changes.
The researchers argued taking those environmental factors into account during long-term field trials would lead to better data analysis.