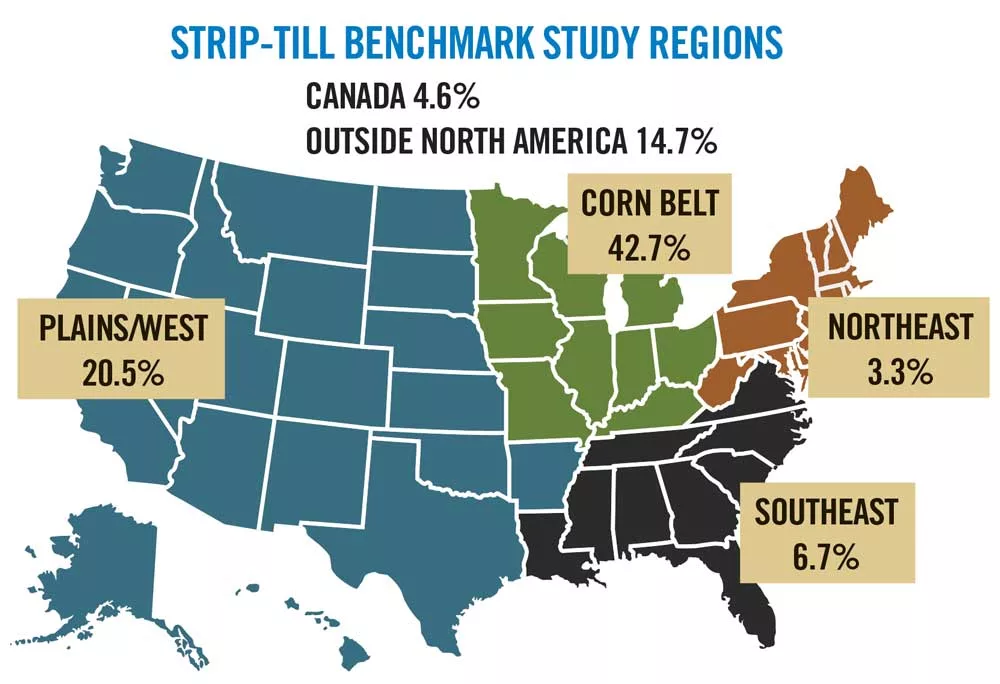
Pictured Above: BRANCHING OUT. While the Corn Belt maintained its stronghold with more than 42% of strip-tillers located in the central part of the U.S., the plains and western states were well-represented, stretching from California to Texas.
Results of the 7th Annual Strip-Till Operational Practices Benchmark study, evaluating 2019 cropping practices, saw some subtle and more significant shifts in strip-till practices. Average strip-tilled corn yields topped 200 bushels per acre for the third straight year, while soybean yields remained north of 60 bushels per acre.
More than 300 farmers from 35 states who identified themselves as strip-tillers responded to the 50-question survey from Strip-Till Farmer.
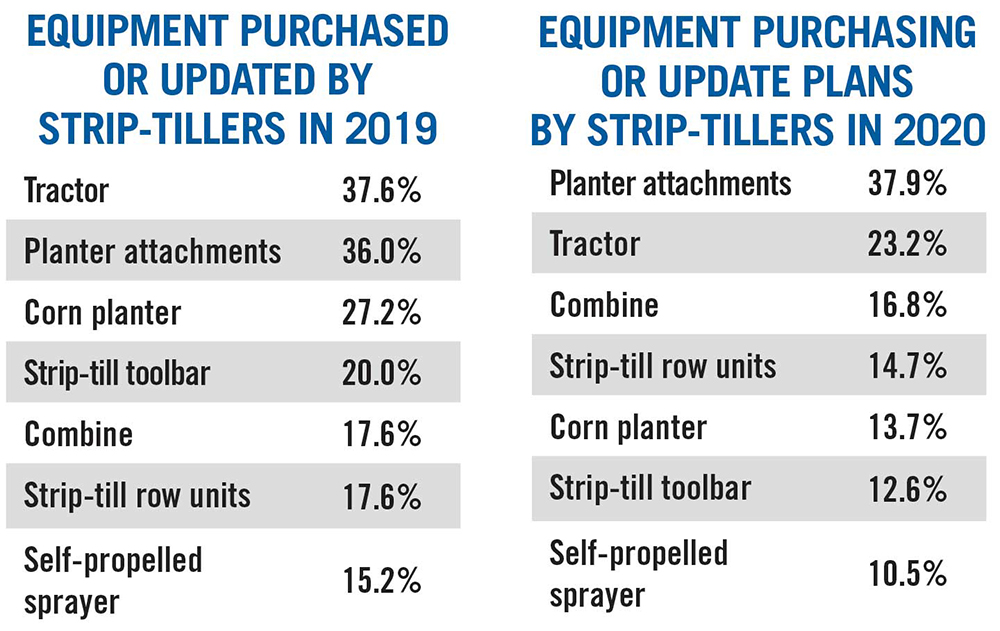
In the following pages — and also within the pages of Strip-Till Farmer’s Summer 2020 issue and online at www.StripTillFarmer.com — we compare and contrast equipment setups, berm-building preferences, nutrient management strategies and more that strip-tillers are putting to work on their operations.
Once again, the core of strip-tillers came from the central U.S., with more than 42% located in the Corn Belt states, and another 20% in from the Plains or Western states.
The demographics of strip-tillers remained relatively unchanged year-over-year, although the 5-year trend shows a gradual aging of the average strip-till farmer, with 73% being at least 45 years old in 2019, compared to 62.7% in 2015.
Some 21.6% indicated that 2019 was their first year strip-tilling, while more than 40% said they’ve been strip-tilling less than 5 years and more than 70% adopted the practice a decade ago or less. About 17% of respondents have been strip-tilling more than 15 years.
Looking at total cropping acres, the average farm size shrunk a bit in 2019, with more than half of respondents indicating they farm 1,000 or fewer acres (52%), compared to 38.5% in 2018. However, the percentage of respondents farming more than 5,000 acres increased slightly, from 3% in 2018 to 4.8% in 2019.
The average acreage being strip-tilled continued a downward trend in 2019, with respondents reporting 719 acres per farm of strip-tilled corn, down from 780 in 2018 and 921 in 2017. Strip-tilled soybean acres also trended down, with an average of 464 in 2019 compared to 517 in 2018 and a high of 552 in 2017.
Megan Wallendal, and her husband, Eric, transitioned 700 acres to organic strip-till on their Grand Marsh, Wis., operation and she notes that finding a nearby organic farmer is a good start to getting a read on the local demand for certified organic crops. Local dairies, livestock operations or grain elevators are good places to look, too. Local market information can provide guidance on what crops to introduce.
“There’s not a huge market for organic rye because there’s a lot of people growing it in our area,” Megan says. “Wheat is better. Some specialty grains are better, too. Corn, soy and specialty grains are where we’re finding the best contracts right now.”
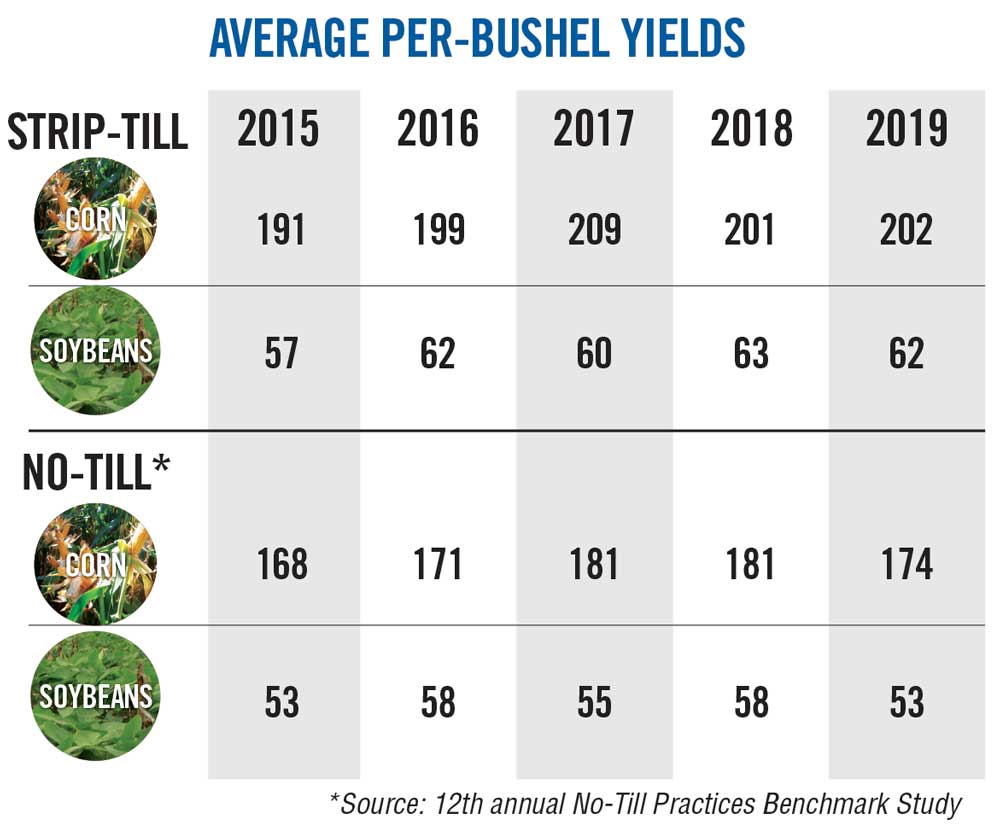
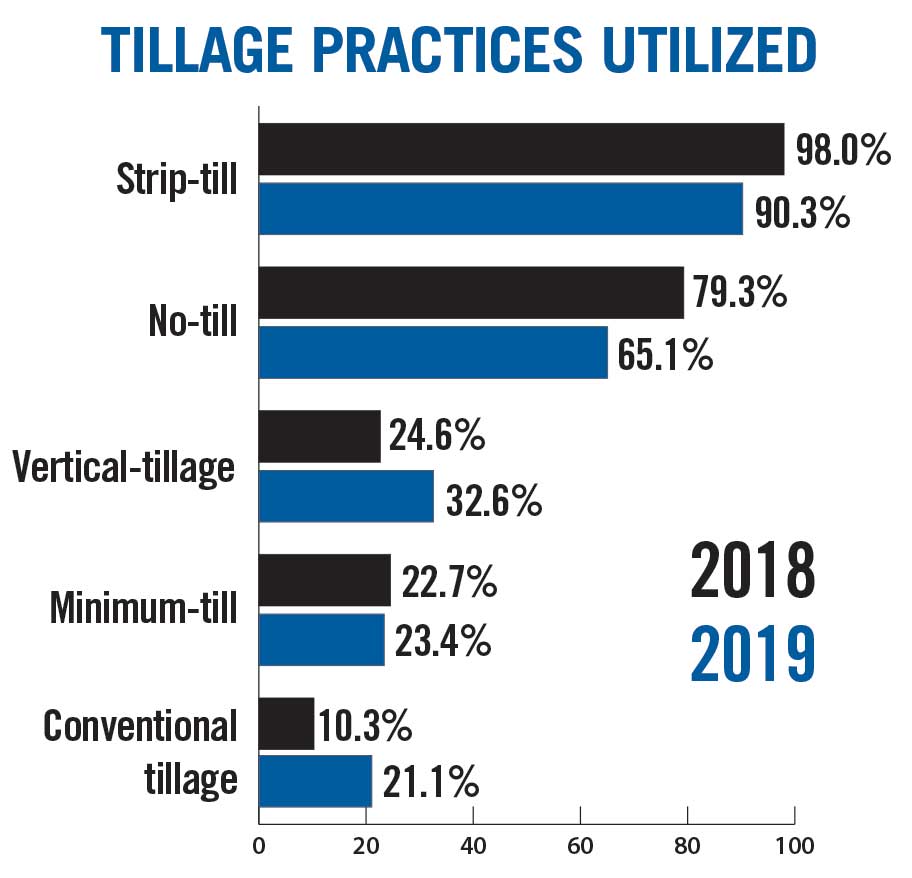
YIELD BUMP. For the third straight year, strip-tillers saw average corn yields top 200 bushels per acre, which was well ahead of no-till corn yields, vertical tillage (178) and minimum tillage (175) according to the 12th annual No-Till Practices Benchmark Study.
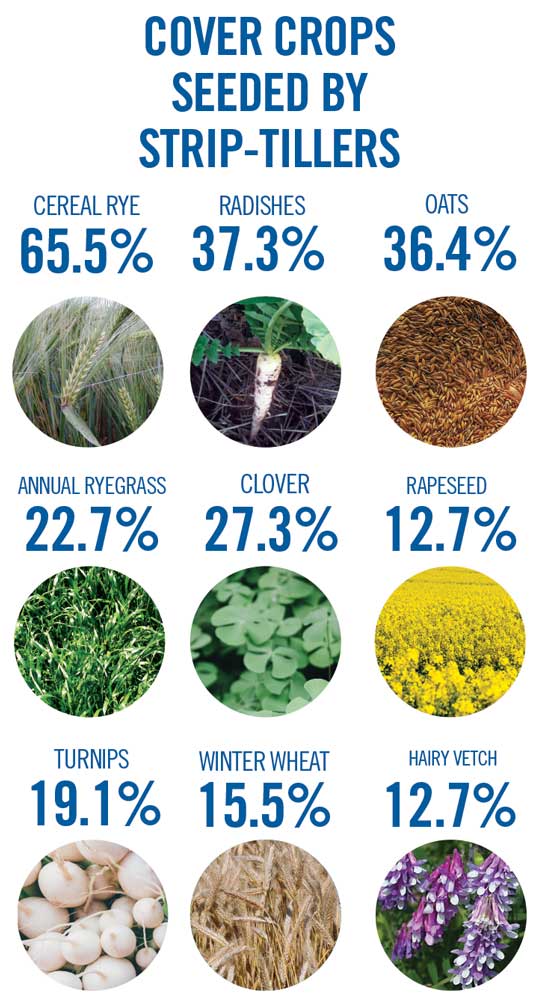
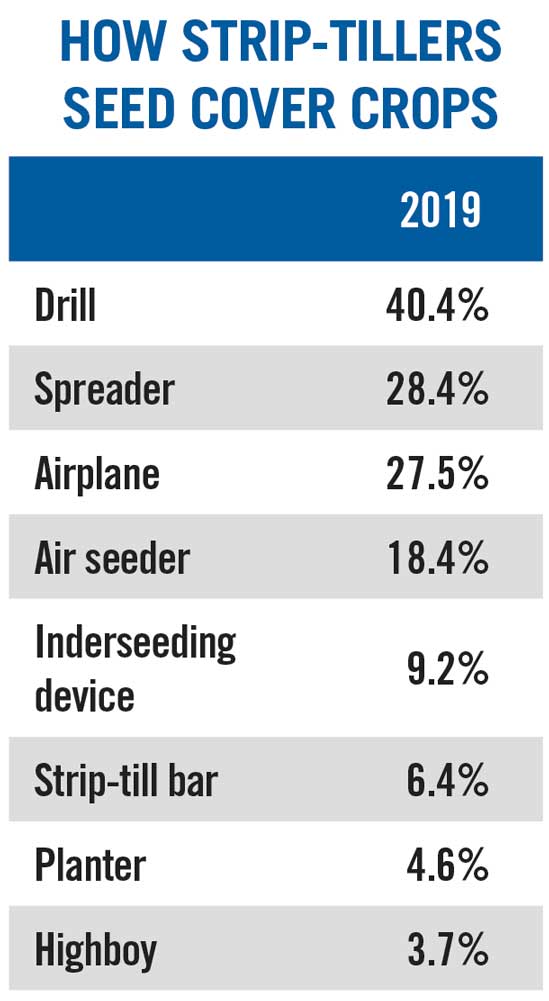
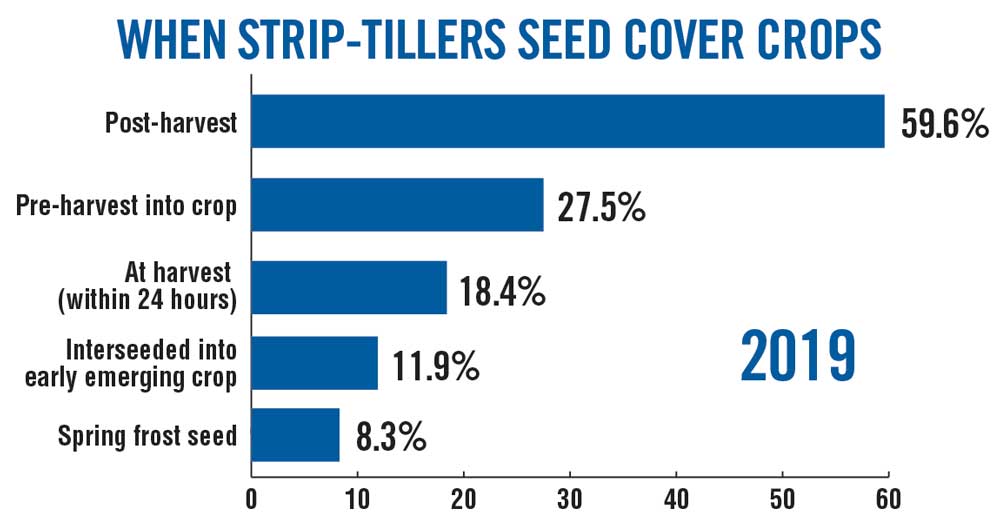
MIX IT UP. The highest percentage of strip-tillers in 5 years reported seeding cover crops in 2019 with cereal rye being the most popular cover crop among strip-tillers. Some 43% seeded a multispecies mix in 2019, down about 7 points from the prior year.
Fertilizing Practices
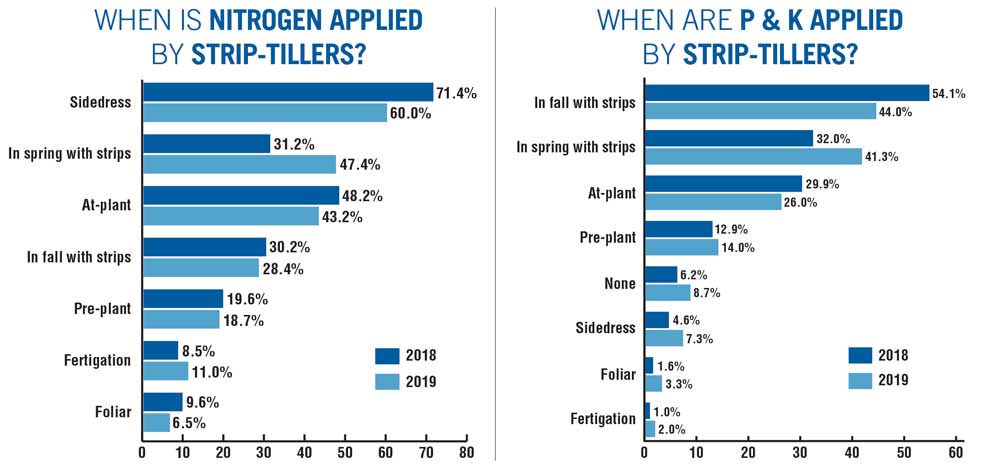
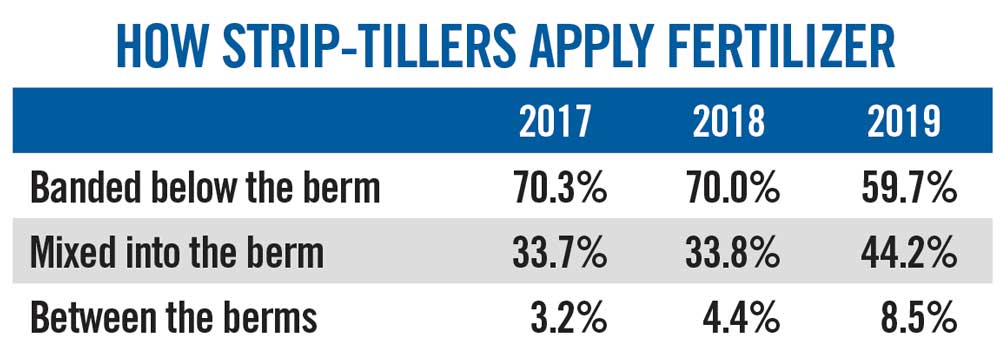
SPLIT APPLICATIONS. Fewer strip-tillers sidedressed N in 2019, while more preferred spring-applied N with a strip-till pass. Strip-tillers also shifted their P and K application timing, with fewer opting for placing in it fall strips in 2019, moving toward a spring strip-till application.
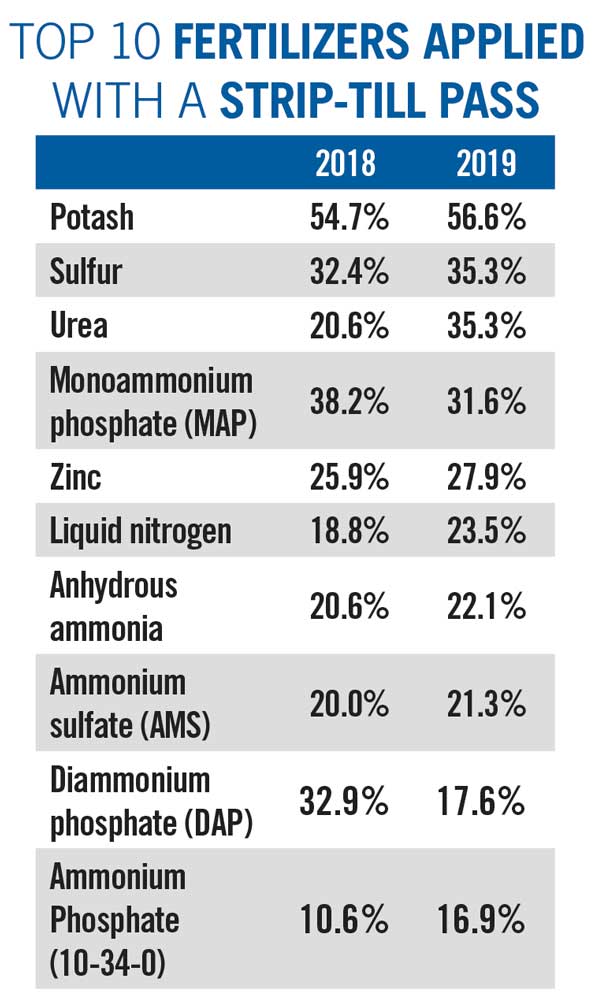
NUTRIENT SHIFT. While potash remained the most popular fertilizer to apply during a strip-till pass, fewer strip-tillers applied DAP in 2019, while more applied urea, 10-34-0 and liquid nitrogen.
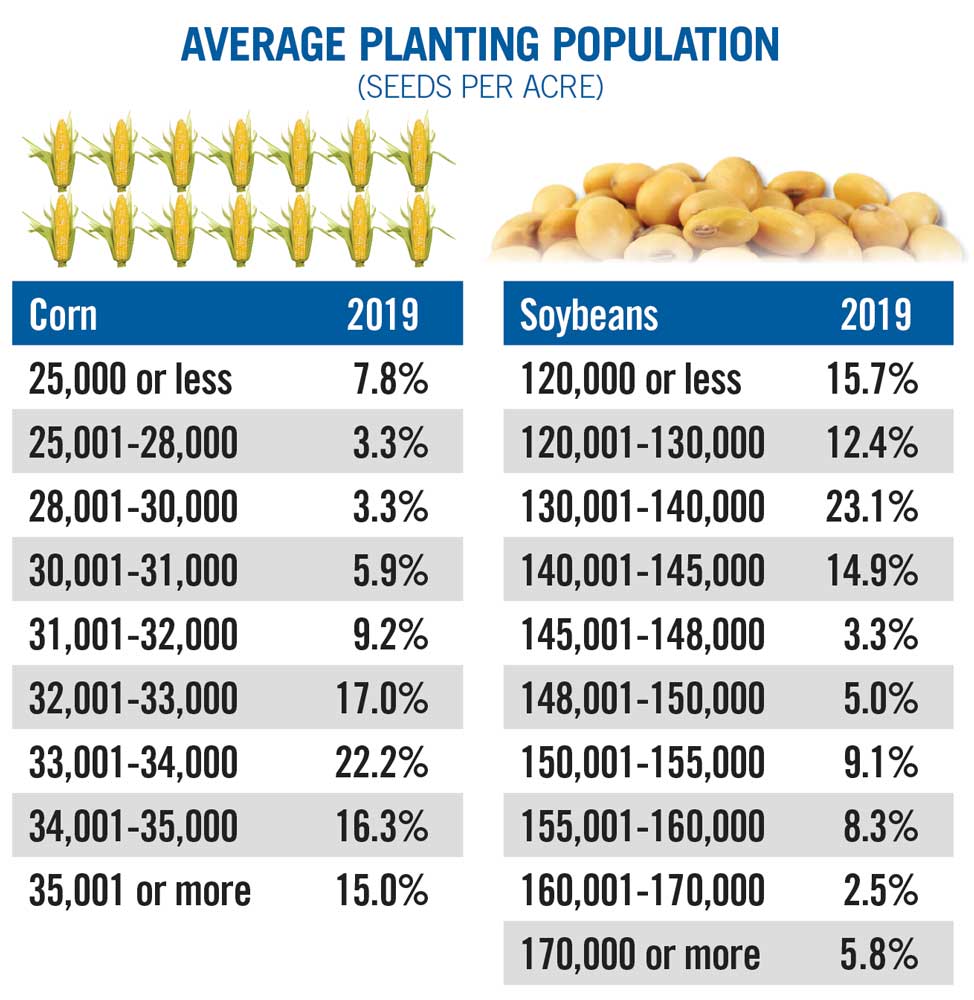
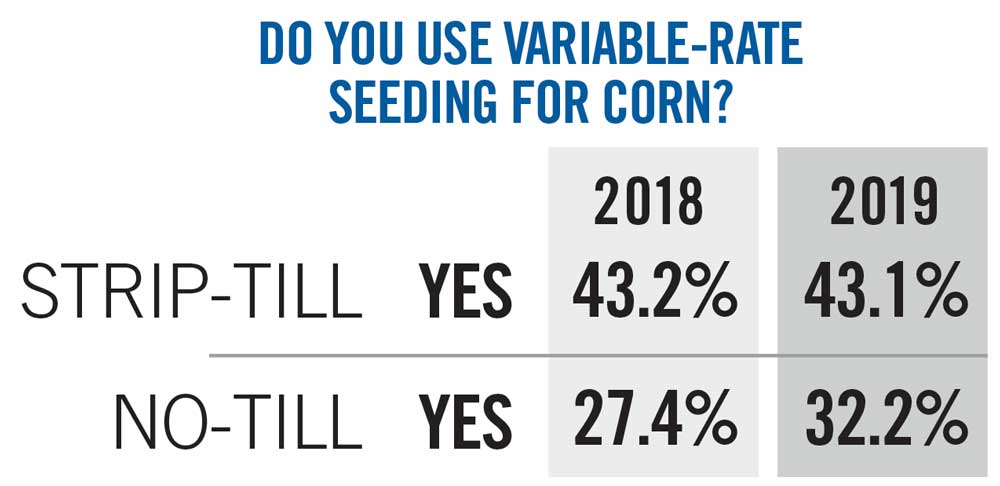
SEEDING STABILITY. Strip-tillers were consistent with their seeding rates for both corn and soybeans in 2019, compared to prior years, with 70% averaging at least 32,000 seeds per acre for corn and 66% averaging less than 145,000 seeds per acre for soybeans.

