Have you ever participated in small plot research? You create small plots with tape measurers and orange flags. A lot of it is done by hand, or if you’re lucky, with some small, specialized equipment.
Farmers have centuries of data from small-plot research — I found a small-plot study dating back to 1784 — and we’ve used small plot research to figure out things like the nitrogen (N) yield response curve. That’s the formula that tries to correlate N rate to yield response, so you can find the profit-maximizing input rate and profit-maximizing quantity of production based on the price of N and corn.
But we know that yield doesn’t just respond to N. It responds to N, herbicides, managed inputs — stuff that varies over space and time. All of that goes into how much corn you grow.
And even though we’ve been doing small-plot research for centuries, we still lack the data to understand how all of those variables combined influence yield. Because small-plot trials are just that — they’re small. They’re not necessarily telling you what’s happening across the field, let alone across the state. And the data they provide generally are not from a field that a farmer is trying to manage.
You may ask: What about big data? For about 10 years now, people have been jumping up and down about gathering agricultural big data. It comes from satellites, it comes from sensors, and you have about a gazillion and a half data points.
But if you don’t have your own on-farm experimental data — and I know this is a little controversial — you can take as many pictures from satellites as you want, and you won’t know how to respond to those pictures with management.

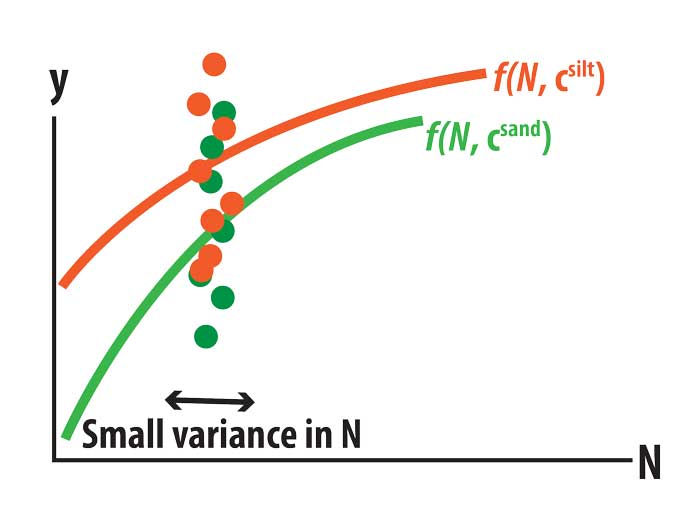
NO CURVE. Data points from satellites and drones don’t help farmers with management. In this trial, a farmer didn’t vary nitrogen (N) application rate enough in silty and sandy soils, so it’s impossible to run a curve through the data to assess how yield responds to N.
Why? Because if the grower doesn’t change their management enough, the data won’t tell you anything.
The chart shown here is a good example of this. Here the farmer applied N in both sandy soil (green dots) and silty soil (orange dots). But he didn’t vary his N rates enough, so the data collected from the imagery is just one column. You can’t run a curve through a column of data, and you can’t find those curves because you’re not changing management.
Now you might say, “Well, I’m paying for one of these companies to give me a prescription. What’s going on there?”
There are a lot of claims about how much money you can make buying those prescriptions. But whatever those prescription packages are using to give you these recommendations, it’s not coming from data in your fields.
The only solution to determining the optimum N rates, or any management decision for your fields and conditions, is conducting experiments on your own farm using precision ag technology.
On-farm precision experiments are implemented by farmers on their own fields to get information about how to manage those fields. You can use much more acreage much cheaper and get better results, compared to small-plot experiments. Plus, you can do your own precision experiments for multiple years, so you’re not making decisions on just 1 year of data.
I’d like to see farmers always doing little experiments — or maybe big experiments — in parts of their fields. I want to see you always gathering information. That’s the only way you’ll know how your yield is responding to different things.
To help farmers conduct their own on-farm trials, I lead the Data Intensive Farm Management (DIFM) research team. We work with farmers on all crops across the U.S. to learn more about their fields by conducting on-farm precision experiments. To learn more about DIFM and how to participate, visit striptillfarmer.com/precision-experiments.


