Cover crops started as somewhat of an enigma in strip-till, with farmers researching and testing the best mixes and seeding methods to achieve desired results. But the last few years have seen an explosion in the adoption and application of cover cropping in strip-till, as well as other conservation tillage systems.
In just 4 years of tracking use of cover crops in strip-till systems, the practice has grown more than 17% to a high of 61.2% in 2016 as revealed through analysis of the 4th Annual Strip-Till Operational Benchmark Study.
The percentage of farmers planting cover crops in strip-tilled fields started at 44.1% in 2013, and had grown steadily each year, to 48.4% in 2014 and 53.3% in 2015.
Strip-tillers’ incorporation of cover crops is trending on the same plane as no-tillers’ as reported by No-Till Farmer’s recent 9th Annual No-Till Operational Benchmark Study. Some 77% of respondents to the no-till study said they utilized cover crops, an all-time high, and an increase for the fourth straight year.
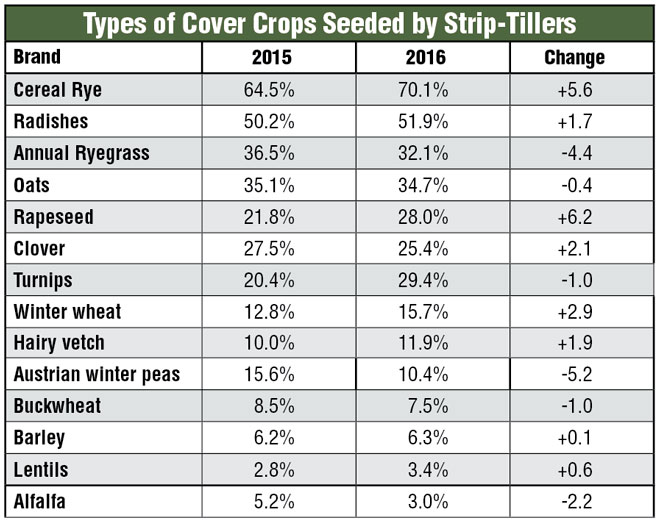
For the third year in a row, cereal rye topped the list of the most popular cover crop species. Some 70.1% of benchmark respondents reported seeding cereal rye last year, compared to 65.5% in 2015 and 60.2% in 2014.
After a 10-point dip from 2014 to 2015, radishes stabilized as the second most utilized cover crop, at 51.9% in 2016, followed by oats (34.7%). Rounding out the top 5 was annual ryegrass at 32.1%, which continued a downward trend in usage, dropping 14 points since 2014, followed by rapeseed at 28%, a 6-point bump over 2015.
More Strip-Till Benchmark Study Analysis
Dig deeper into equipment setup, strip-building preferences, fertilizing practices and precision farming usage in extended online analysis from the 4th Annual Strip-Till Operational Benchmark Study. Learn about which strip-till rig and GPS correction signal brands are most popular, as well as when and what types of nitrogen, phosphorus and potassium strip-tillers are applying in their operation.
Row Cleaners, Fertilizer Boxes, RTK are Popular Strip-Till Choices
Stability in Size, Setup of Equipment, Separation in Timing of Field Preparation
Drilling Down
For the first time, the benchmark study asked strip-tillers to identify their preferred method for seeding cover crops. Far and away the most popular option was drilling them in, with 45.5% of respondents preferring this method.
A distant second was aerial application (26.7%), followed by spreading cover crops (23.8%). Next most popular was air seeder application (17%), then a high-boy (13.4%) and interseeding (10.5%).
A handful of respondents noted they seeded cover crops with their strip-till rig, while other methods included broadcasting them and incorporating them with a vertical tillage unit, and, perhaps most interestingly, helicopter application.
Rate Increase
Looking at corn seeding populations preferred by strip-tillers, the average increased slightly last year to 33,219 seeds per acre, compared to 32,970 in 2015. This increase brought the average back in line with the 2013 and 2014 averages of 33,194. The modest year-over-year increase widened the gap between average corn seeding populations for strip-tillers and no-tillers of 31,403 seeds per acre, as reported in No-Till Farmer’s recent benchmark study.
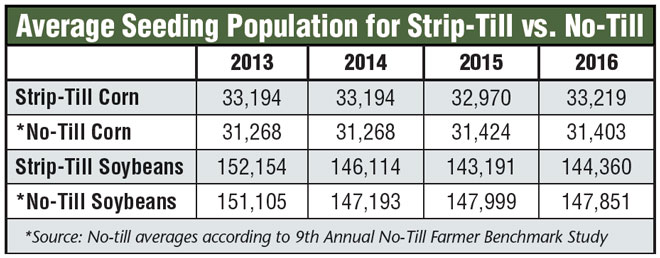
Strip-tillers also marginally increased their average soybean seeding population rates from 143,191 seeds per acre in 2015 to 144,360 in 2016. However, this is still well below those reported in 2014 (146,114) and 2013 (152,154). Last year’s total was also about 3,400 seeds per acre higher than the average planted by no-tillers (147,851) according to the no-till benchmark study.
The Top 10%
Cover crops were part of 70% of the top strip-tillers’ operations in 2016, about 9 points ahead of the overall group and 2 points higher than 2015. Some 60% drilled in their cover crops, about 15% more than the overall group.
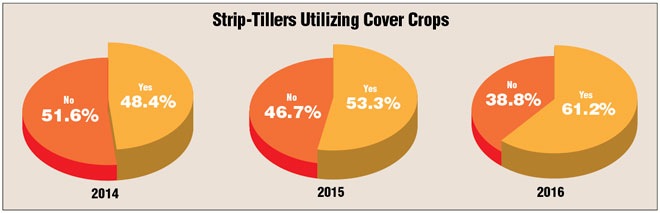
WELL COVERED. In just 4 years of tracking use of cover crops in strip-till systems, the practice has grown more than 17 points, to a high of 61.2% in 2016.
While the average corn seeding rate for the overall group increased, the top 10% trimmed their average rate by about 1,000 seeded per acre, year-over year. In 2016, the top yielders averaged 33,831 seeds per acre, compared to 34,750 in 2015.
The top strip-tillers cut their average soybean seeding rates even more dramatically — about 10,000 seeds per acre — to 131,071 in 2016, compared to 142,902 in 2015.